Normalization principle dictate that we keep our tables as narrow as possible, i.e. only few columns wide to keep the table schema simple and performant.
It does create a problem when you need to display data in a columnar format or pivot format. For example take a look at the following query...
SELECT C.Name, O.Total As Total,O.Year
FROM Customers C INNER JOIN Orders O ON C.CustomerID = O.CustomerID
The result will look something like this...
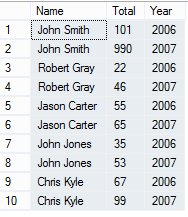
but what if you want to display the information in a columnar format, like an excel spreadsheet with Names going vertically but years going horizontally.
Using Pivot function you can achieve just that. Take a look at the query below...
SELECT * FROM
(SELECT C.Name, O.Total As Total,O.Year
FROM Customers C INNER JOIN Orders O ON C.CustomerID = O.CustomerID
) A
PIVOT
( SUM(Total) FOR Year IN ([2006],[2007])
) AS TotalAmt
The result will be as follows...

Data is displayed in much more readable and organized manner.
PIVOT function allows you to pivot a column for another column, as we did in the above example, i.e. pivot Total for Year.
You may be wondering about using nested query. If you don't use nested query you will get a duplicate field error. This is because as you can see from the previous result set, there are multiple customers with same name and we are joining two tables (Orders and Customers) on Customer ID field which results in duplicate field error when trying to pivot.
Thank you.
It does create a problem when you need to display data in a columnar format or pivot format. For example take a look at the following query...
SELECT C.Name, O.Total As Total,O.Year
FROM Customers C INNER JOIN Orders O ON C.CustomerID = O.CustomerID
The result will look something like this...
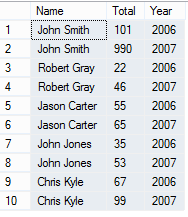
Using Pivot function you can achieve just that. Take a look at the query below...
SELECT * FROM
(SELECT C.Name, O.Total As Total,O.Year
FROM Customers C INNER JOIN Orders O ON C.CustomerID = O.CustomerID
) A
PIVOT
( SUM(Total) FOR Year IN ([2006],[2007])
) AS TotalAmt
The result will be as follows...

Data is displayed in much more readable and organized manner.
PIVOT function allows you to pivot a column for another column, as we did in the above example, i.e. pivot Total for Year.
You may be wondering about using nested query. If you don't use nested query you will get a duplicate field error. This is because as you can see from the previous result set, there are multiple customers with same name and we are joining two tables (Orders and Customers) on Customer ID field which results in duplicate field error when trying to pivot.
Thank you.